

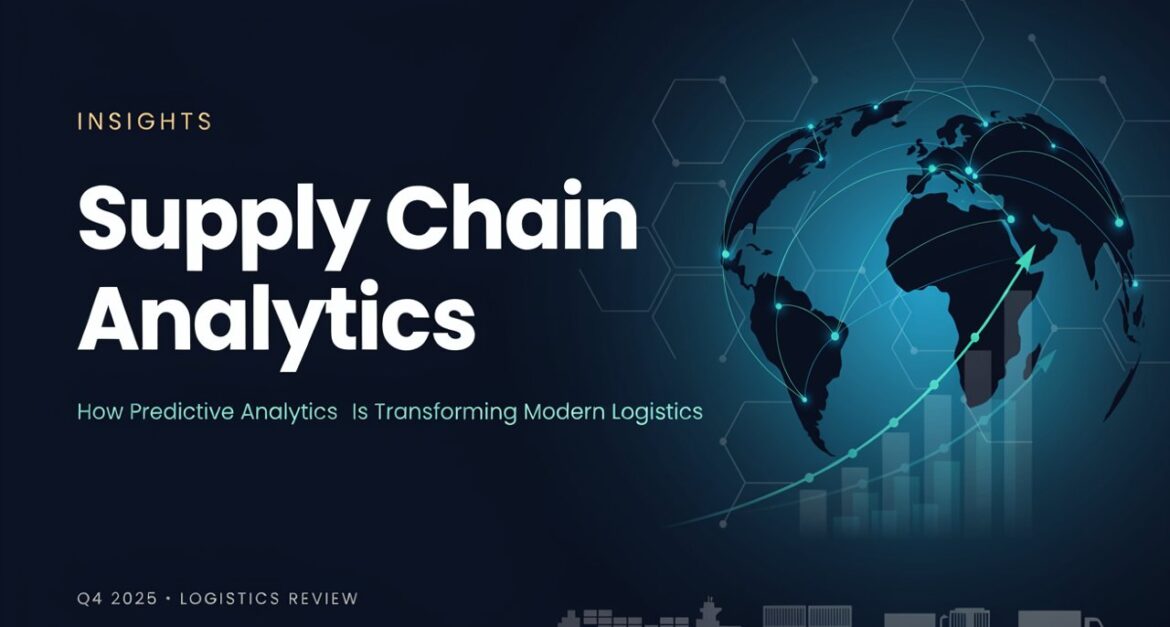
Every business that moves physical goods eventually runs into the same wall: too much guesswork, not enough foresight. A supplier misses a shipment. A warehouse over-orders stock that sits unsold for months. A truck gets stuck at a port with no warning until it’s already three days late. These aren’t rare events — they’re the default state of supply chains that run on spreadsheets, gut feeling, and last quarter’s numbers.
The businesses pulling ahead aren’t the ones with bigger warehouses or more trucks. They’re the ones that can see disruptions coming before they happen. That shift — from reacting to disruptions to predicting them — is what supply chain analytics, and specifically predictive analytics, has made possible. At Palm Horizon KSA, we work with logistics and operations teams who are tired of firefighting and want a supply chain that tells them what’s coming next, not just what already went wrong.
This guide breaks down what supply chain analytics actually is, how predictive analytics fits into it, where it delivers real value, and how a business can start using it without turning operations upside down.
What Is Supply Chain Analytics?
Supply chain analytics is the practice of collecting and examining data from every stage of the supply chain — sourcing, manufacturing, warehousing, transportation, and delivery — to make better, faster, and more informed decisions. Instead of relying on assumptions or static reports, businesses use real data from their own operations to understand what’s actually happening and why.
Modern logistics generates enormous amounts of data: order volumes, delivery times, warehouse throughput, supplier performance, fuel costs, vehicle locations, and customer demand patterns. Supply chain analytics turns that raw data into something usable — patterns, trends, and forecasts that guide day-to-day and long-term decisions.
There are four recognized types of supply chain analytics, each answering a different question:
- Descriptive analytics – What happened? Summarizes past performance, such as monthly delivery times or order volumes.
- Diagnostic analytics – Why did it happen? Digs into root causes, like why a particular route consistently runs late.
- Predictive analytics – What’s likely to happen next? Uses historical and real-time data to forecast future events.
- Prescriptive analytics – What should we do about it? Recommends specific actions based on predicted outcomes.
These four types build on each other, moving from simple reporting toward genuinely proactive decision-making — which is exactly why predictive analytics is drawing so much attention in logistics right now. As supply chains become more global, more complex, and more vulnerable to disruption (port congestion, fuel price swings, extreme weather, geopolitical shifts), analytics has stopped being a “nice to have” and become a core requirement for staying competitive.
The chart above shows how business value and implementation complexity both climb as you move from descriptive toward prescriptive analytics — predictive analytics sits at the point where the payoff starts to significantly outweigh the effort required to get there.
How Does Supply Chain Analytics Work?
Supply chain analytics isn’t a single tool — it’s a process. Here’s how it typically works, step by step:
- Data collection – Information is gathered from warehouses, suppliers, transportation providers, order systems, and customers. This includes everything from inventory counts to GPS coordinates of trucks in transit.
- Data integration – Data from different systems (ERP, WMS, TMS, CRM) is combined into a single, consistent view, since siloed data is nearly impossible to analyze meaningfully.
- Data analysis – Analysts and algorithms look for trends, patterns, bottlenecks, and inefficiencies hiding in the combined dataset.
- Prediction – Statistical models and machine learning use historical and real-time data to forecast what’s likely to happen — demand spikes, delivery delays, equipment failures, and more.
- Decision-making – Insights are translated into concrete actions: adjusting stock levels, rerouting shipments, renegotiating with a risky supplier.
- Continuous monitoring – Results are tracked over time, and models are refined as new data comes in, so accuracy improves the longer the system runs.
This cycle never really “finishes” — it’s a loop. The more data that flows through it, the sharper the predictions become, which is why businesses that start early with supply chain analytics tend to pull further ahead of competitors who wait.
What Is Supply Chain Predictive Analytics?
Supply chain predictive analytics is the branch of analytics specifically focused on forecasting future events using historical data, real-time inputs, statistical modeling, and machine learning. Rather than just explaining what already happened, predictive analytics estimates what’s coming — with enough lead time to actually do something about it.
Common applications include:
- Demand forecasting – Predicting how much of a product customers will want, and when.
- Delivery delay prediction – Flagging shipments likely to arrive late based on traffic, weather, and carrier history.
- Inventory requirements – Estimating the right stock levels to avoid both shortages and excess.
- Supplier risk – Identifying suppliers likely to cause disruptions based on past performance and external signals.
- Transportation demand – Forecasting freight capacity needs across regions and seasons.
- Equipment maintenance – Predicting when machinery or vehicles are likely to fail, before they actually do.
The underlying idea is straightforward: the supply chain already generates the data needed to see problems coming. Predictive analytics just puts that data to work instead of letting it sit unused in a database.
Fun fact: the concept of predictive modeling isn’t new at all — actuaries have used statistical forecasting to price insurance risk since the 1800s. What’s changed in logistics is the sheer volume and speed of data available, thanks to IoT sensors and GPS tracking, which lets the same statistical principles run in near real time on millions of data points instead of a handful of tables.
Predictive Analytics in Supply Chain: How Does It Help?
Once predictive models are in place, they change how a business operates day to day. Specifically, predictive analytics in supply chain management helps businesses:
- Forecast demand more accurately, reducing the guesswork behind purchasing and production decisions.
- Reduce stockouts by flagging when demand is likely to outpace current inventory.
- Avoid excess inventory, which ties up cash and increases storage costs.
- Predict transportation delays before they disrupt customer delivery promises.
- Identify supply risks early enough to diversify or renegotiate with suppliers.
- Improve warehouse planning by forecasting labor and space needs ahead of demand surges.
- Optimize delivery schedules, cutting fuel costs and improving on-time performance.
The common thread across all of these is lead time. A business that knows about a possible delay two weeks in advance has options — a business that finds out the day it happens has none. That’s the practical difference predictive analytics makes.
Predictive Analytics Supply Chain Applications
Predictive analytics isn’t a single feature — it shows up across nearly every function in the supply chain. Here’s where it delivers the most value:
1. Demand forecasting Predicts future customer demand so purchasing and production decisions are based on data rather than assumptions, reducing both overstock and missed sales.
2. Inventory optimization Determines appropriate stock levels and replenishment timing for each product and location, balancing carrying costs against the risk of running out.
3. Predictive maintenance Uses sensor and usage data from vehicles and equipment to flag potential failures before they cause unplanned downtime.
4. Transportation optimization Forecasts delays, congestion, and shifting transportation demand, helping logistics teams plan routes and capacity proactively.
5. Supplier risk management Identifies suppliers whose performance patterns suggest a higher chance of future disruption, giving procurement teams time to act.
6. Delivery prediction Improves estimated delivery times by combining historical delivery data with real-time conditions like traffic and weather.
7. Warehouse planning Forecasts workload and staffing needs ahead of demand peaks, so warehouses aren’t caught understaffed during busy periods.
Fun fact: some of the largest retailers run demand-forecasting models that update multiple times per day, factoring in everything from local weather forecasts to social media trends — a single unexpected heatwave can shift regional demand for certain products by a significant margin within hours.
7 Benefits of Supply Chain Analytics
1. Better decision-making Decisions are grounded in real data instead of assumptions, cutting down on costly guesswork.
2. Lower operating costs Inefficiencies and unnecessary expenses become visible and fixable once they’re actually measured.
3. Improved demand planning More accurate forecasts mean businesses can prepare for demand shifts rather than scrambling to react to them.
4. Better inventory control Stock levels stay closer to what’s actually needed, reducing both waste and shortages.
5. Faster response to disruptions Risks are flagged earlier, giving teams more time to adjust before a small problem becomes a big one.
6. Improved delivery performance Analyzing transportation data helps identify and reduce recurring sources of delay.
7. Greater supply chain visibility Teams gain a clearer, end-to-end view of operations, instead of fragmented insight from disconnected systems.
How Technology Powers Supply Chain Analytics
Supply chain analytics doesn’t run on spreadsheets alone. It depends on a stack of interconnected technologies:
- Artificial intelligence and machine learning – Power the pattern recognition and forecasting behind predictive models.
- IoT sensors – Provide real-time data from equipment, vehicles, and storage conditions.
- GPS tracking – Feeds live location data for shipments and fleets.
- Cloud platforms – Allow data from multiple locations and systems to be processed and accessed centrally.
- Big data infrastructure – Handles the volume and speed of data generated across a modern supply chain.
- Transportation management systems (TMS) – Manage and optimize freight movement.
- Warehouse management systems (WMS) – Track inventory and operations within storage facilities.
- ERP integration – Connects analytics to core business processes like finance, procurement, and sales.
None of these technologies work in isolation — the real value comes from integrating them so that data flows smoothly from the warehouse floor to the decision-maker’s dashboard.
Supply Chain Analytics vs Predictive Analytics
These two terms are often used interchangeably, but they’re not quite the same thing. Predictive analytics is one component within the broader field of supply chain analytics.
| Supply Chain Analytics | Predictive Analytics |
| Analyzes supply chain data | Predicts future outcomes |
| Explains current performance | Forecasts potential events |
| Identifies trends | Identifies likely future trends |
| Supports operational decisions | Supports proactive decisions |
In short: supply chain analytics tells you what’s going on. Predictive analytics tells you what’s likely to happen next. A mature analytics strategy uses both — understanding the present while preparing for the future.
How Businesses Can Start Using Supply Chain Analytics
Getting started doesn’t require ripping out existing systems. Palm Horizon typically guides businesses through a phased approach:
- Identify important business problems. Start with the pain points that matter most — chronic stockouts, late deliveries, unpredictable supplier performance.
- Collect reliable supply chain data. Ensure data from warehouses, transportation, orders, and suppliers is accurate and consistently recorded.
- Integrate data sources. Connect ERP, WMS, TMS, and other systems so data doesn’t stay siloed.
- Select appropriate analytics tools. Choose platforms suited to the business’s size, industry, and technical maturity.
- Establish KPIs. Define what success looks like — on-time delivery rate, inventory turnover, forecast accuracy.
- Introduce predictive models where useful. Start with one high-impact use case, like demand forecasting, rather than trying to predict everything at once.
- Monitor results. Track whether predictions are translating into better outcomes.
- Continuously improve the process. Refine models and expand use cases as data quality and team confidence grow.
Businesses that succeed with supply chain analytics rarely start big. They start with one clear problem, solve it with data, prove the value, and expand from there.
Fun Facts About Supply Chain Analytics
- The word “logistics” originally comes from military supply operations — armies have been optimizing the movement of goods and resources for centuries, long before the term ever touched a warehouse.
- Some global retailers manage inventory across hundreds of thousands of SKUs simultaneously, which is part of why manual forecasting became impossible decades ago and automated analytics took over.
- Predictive maintenance models can sometimes detect early signs of equipment failure — like subtle vibration changes in a conveyor motor — well before a human inspector would notice anything unusual.
- A single day of port congestion can ripple through a supply chain for weeks, which is exactly the kind of cascading disruption predictive analytics is designed to catch early.
Frequently Asked Questions
What is supply chain analytics used for?
It’s used to turn raw operational data — from warehouses, suppliers, transportation, and orders — into insights that improve decision-making, reduce costs, and increase visibility across the entire supply chain.
How is predictive analytics different from traditional supply chain reporting?
Traditional reporting looks backward, summarizing what already happened. Predictive analytics looks forward, using historical and real-time data to forecast what’s likely to happen next, giving teams time to act before a problem occurs.
Can small and mid-sized businesses use supply chain analytics, or is it only for large enterprises?
Businesses of any size can use it. The key is starting with one clear, high-impact problem — like demand forecasting or delivery delay prediction — rather than trying to implement every capability at once.
What kind of data is needed to start using predictive analytics in a supply chain?
At minimum, reliable historical data on orders, inventory levels, supplier performance, and delivery times. Real-time data from IoT sensors and GPS tracking further improves prediction accuracy over time.
How long does it take to see results from supply chain analytics?
This varies by use case, but many businesses see measurable improvements — such as fewer stockouts or better on-time delivery — within the first few months of focused implementation, especially when starting with a single well-defined use case.
Does predictive analytics replace human decision-making in logistics?
No. Predictive analytics informs decisions by surfacing risks and forecasts early; people still make the final call. It’s a tool for better-informed decisions, not a replacement for logistics expertise.
Final Thoughts
Supply chains built on guesswork are becoming a competitive liability. The businesses that thrive going forward will be the ones that can see disruptions coming — a late shipment, a demand spike, a struggling supplier — while there’s still time to act, not after the damage is done.
Supply chain analytics, and predictive analytics in particular, is what makes that possible. It’s not about replacing experienced logistics teams with algorithms; it’s about giving those teams the foresight they’ve never had before. At Palm Horizon KSA, we help businesses take that first step — starting with one real problem, building a data foundation around it, and growing into a supply chain that predicts disruption instead of just reacting to it.
If your supply chain still runs on hindsight, the shift to foresight starts with a single decision: to start measuring, forecasting, and acting on the data you already have.

1 Comment
7 Logistics KPIs for Better Warehouse and Shipping Results September,04 2026
[…] The problem is that feelings don’t fix bottlenecks. Numbers do. That’s where logistics KPI tracking comes in, and it’s exactly what separates growing logistics brands like Palm Horizon […]